cause circle brand logo
    MANAGE
    Profile
    User Name
    Role
    PROFILE
    View Profile
    SETTINGS
    Edit Profile
    STAGE ENVIRONMENT
    Stage Environment
    MANAGE
    Logout
    Sign In
    Profile
    User Name
    Role
    PROFILE
    View Profile
    CONTENT
    Content Events
    SETTINGS
    Edit Profile Privacy & Security Notification Settings Connected Accounts
    MANAGE
    SUPPORT
    Guide Help Center
    Donation collected 11 Donations
    US,366,460 Collected
    Logout
    • Home
    • Stories
    • About CauseCircle
    • Blog
    • How It Works
    • Nonprofit Directory
    • Claim Listing
    • Why CauseCircle?
    • For Corporations
    • Feedback
    • Contact Us
    • Home
    • Stories
    • About
      • About CauseCircle
      • Blog
    • Nonprofits
      • How It Works
      • Nonprofit Directory
      • Claim Listing
    • Why CauseCircle?
    • For Corporations
    • Feedback
    • Contact Us
    Send Feedback

    Help us improve CauseCircle

    We value your feedback! Please let us know if you've encountered any issues, bugs, or if you have suggestions for improving our platform.

    Thank You!

    Thank you for your feedback!

    Your feedback helps us:

    • Fix issues and improve platform stability
    • Develop new features based on user suggestions
    • Make CauseCircle better for everyone
    Follow a Nonprofit First

    To create posts, you need to follow at least one nonprofit. Find nonprofits that align with your values and start following them!

    Follow This Nonprofit First

    To post about this nonprofit, you need to follow them first! Click the follow button on this page to get started.

    cause circle brand logo
    1 Story Information
    2 Share
    Step icon

    Please select an NPO.

    Choose images or videos, or drag & drop them here.

    JPEG, PNG, MP4 and other formats, up to 30 MB each. Maximum 5 media files allowed.

    Please enter a story description.
    Please select a category (optional).
    Step icon

    Share Link

    Spread the word on your favorite platforms.

    Organization
    posted by

    Story Statistics

    2,345 Reads

    80 Shares

    320 Likes

    Related Stories

    1 year ago

    BMO Called to Act Now as Indigenous and Environmental Groups Target Canada’s Third Largest Bank in Growing Climate Campaign

    Photo credit: Greenpeace Canada

    Toronto, Canada — Wednesday, August 28, 2024 — A coalition of Indigenous, Environmental and Social justice organizations, has expanded its climate campaign to include the Bank of Montreal (BMO). Building on the momentum of its successful efforts targeting Royal Bank of Canada (RBC), groups including For Our Kids, Indigenous Climate Action, Protect Our Winters Canada, Greenpeace Canada, STAND.earth, Change Course, Re:Generation, Gidimt’en Checkpoint, Shift Action for Pension Wealth and Planet Health, and Decolonial Solidarity are now urging BMO to support and grow investment in clean energy and to demonstrate its commitment to social responsibility by aligning its investment practices with a climate-safe world, while winding down fossil fuel investments.

    “BMO has made strong claims about ‘growing the good,’ yet continues to be one of the top fossil fuel funders globally and among the worst for funding renewable energy,” said Richard Brooks, Climate Finance Director with Stand.earth. “Does BMO really want to be known as the bank that is growing the climate crisis including fires and floods that its customers are increasingly experiencing?  We are calling on BMO to live up to its promises and lead the way in Canada’s transition to a low-carbon economy.”

    An open letter was delivered digitally and in person to BMO’s Toronto Yonge-Dundas Campus office by concerned parents and children from For Our Kids, a parent-led network of volunteers, driven to take climate action for their kids, grandkids, and future generations.

    Read the full letter here: It’s Time for BMO to Boldly Grow the Good on Climate

    The letter, directed to BMO’s CEO, Darryl White, highlights BMO’s worst in Canada ratio of renewable energy to fossil fuel energy investments, despite the bank’s stated commitment to climate and sustainability . The letter calls for BMO to take immediate and meaningful action to reduce its financing of fossil fuels, meet more ambitious targets for renewable energy financing, and drop its association with anti-climate oil and gas lobby groups.

    To amplify this message, a small family-friendly demonstration was held outside BMO’s Yonge/Dundas campus in downtown Toronto on August 28th. The event featured activities such as a climate quiz for parents and children, postcard writing to CEO Darryl White, and a kids’ dance party. The demonstration aimed to pressure BMO to stop what activists describe as “greenwashing” and to genuinely shift towards funding a green future.

    “BMO recognizes the need for a rapid green transition, and could be a leader on climate, but unfortunately, its actions aren’t living up to its words,” said Brianne Whyte, a Toronto-based mother of a 4-year-old, and an organizer with For Our Kids Toronto. “As a father and supporter of Kids Help Phone, CEO Darryl White is clearly invested in children’s wellbeing – but will he protect a livable future by investing in renewable energy and transitioning away from fossil fuels? Canadian families want to see real climate action now, not just empty slogans.”

    The expanded campaign comes in response to increasing public concern about the role of Canadian banks in financing climate chaos. According to the 2024 Banking on Climate Chaos report, BMO has funneled over CAD $200 billion into fossil fuels since 2016, including nearly CAD $22 billion in 2023 alone. This places BMO as the 18th worst bank globally for fossil fuel financing. BMO’s ratio of dirty energy to clean energy investments was found by both BloombergNEF and Influence Map to be the worst of all Canadian banks, who themselves are all global laggards. The bank was also criticized for financing energy projects that lack the Free, Prior, and Informed Consent of Indigenous Peoples.

    ###

    1 year ago

    The invisible threads in supply chain mapping

    Uncovering new clues when the trail goes cold!

    Even with all the experience Stand.earth Research Group (SRG) has with supply chain mapping, it’s still surprising how many countries do not supply customs data that clearly state suppliers and buyers in international trade. For example, while India and Vietnam make their customs data available for analysis, China and Germany do not. This means that when tracking supply chains, we occasionally face challenges with unavailable customs data. This results in what look like dead ends. But over years of investigations, we’ve honed some tools to help us uncover connections even when the trail seemingly goes cold.

    SRG’s Trade Statistics Inference

    Customs data is an important tool for supply chain mapping at SRG, because it indicates the sellers and buyers e.g. of deforestation-driver commodities. But we know we can get around these obstacles using a technique we call “Trade Statistics Inference”. By cross-referencing sub-national trade statistical data with company-level industry data, , we can sometimes infer missing information. We can also find patterns and correlations that help fill in the gaps — in some cases even discovering hidden buyer-seller relationships. 

    Our methodology involves compiling various sources of public information. These include commodity trade statistical data, tariff data, shipping and freight statistics, manufacturing capacities, etc. It also entails identifying all known companies and their subsidiaries, and reviewing annual reports, investor information, industry news, finance websites, government news, and government and trade association directories. 

    Case study: Japanese wood pulp traded to China

    Here is an example of SRG’s Trade Statistics Inference. In this case, the methodology was used to determine company-level trade flows between China and Japan even though neither country releases customs data.   

    We first identify the relevant commodity codes. These codes indicate the type of product being traded. In this case, it is dissolving wood pulp.  Next we access sub-national export statistics by jurisdiction from Japanese and Chinese government databases. We then research the producers and operators active in each country. As shown in the diagram above, the exporters (producers) are dissolving pulp mills in Japan, and the receivers (operators) are the viscose factories in China. For each identified mill or factory, we collect data on ownership, parent and subsidiary companies, mill capacity, operational status (operating or idled), and location. 

    By cross-referencing the trade data with the viscose operators in each province, including relative capacities, we accurately estimate the probability of each Chinese receiver’s sourcing from specific Japanese producers. In this example, dissolving pulp only comes from Shimane Prefecture, so we can infer that all the dissolving pulp that China receives from Japan is from this region. Since there are only two producers in Shimane, and one of them produces 90% of the pulp, we can conclude that the majority of the corresponding viscose mill operators in China are sourcing from this producer. In the final step, we match the capacities of each operator to complete the trail and estimate the volumes traded.

    Great outcomes for our clients

    Using our “Trade Statistics Inference” technique, we can overcome data limitations and enhance the comprehensiveness of supply chain analysis – even when customs data is unavailable. By utilizing supplementary data sources and analytical skills, we still derive meaningful insights and trends. Ultimately, this approach can connect the missing dots. We get more insightful research outcomes, and even illuminate supplier-customer relationships that are normally only possible using customs data. 

    – Phoebe Lam, Operations Manager and Researcher, Stand.earth Research Group

    1 year ago

    Complex data reveals clear goals for building electrification

    The report, Roadmap to Fossil Free Homes, showcases the powerful role of analyzing data with a climate-centric lens to shape sustainable urban policies. 

    Harnessing complex data

    At Stand.earth Research Group (SRG) we often leverage a diverse array of data sources in our research. In this example, we illustrate the climate impact of transitioning to all-electric new residential buildings. The data we used includes energy consumption, new building permits, housing surveys, national emissions inventories, polling on climate knowledge, building electrification policies – and many others! By integrating all these sources and analyzing trends, we provide a comprehensive ranking of regions by the potential benefits of building electrification. In this way, we yield rich insights for climate campaigning that highlight the strategic importance of local actions. 

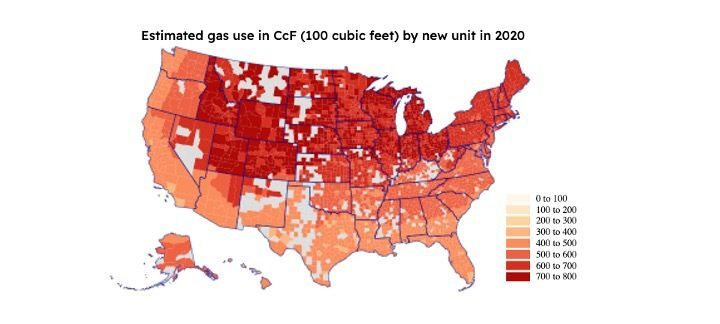
    Our first step was to combine International Energy Conservation Code Climate Zones  with the US Government Census Building Permits Survey We did so at the county level for over 3,000 counties across 50 states. Then, we matched these with the U.S. Energy Information Administration Residential Energy Consumption Survey based on climate zone, division, unit size, and type. This new dataset gave us an estimate of average gas per household type for 2020 by US county. To assess how much gas would be used by an average new build, we used data from the US Government Census American Housing Survey to estimate the percentage of new single and multi units that were using gas by the year of completion. 

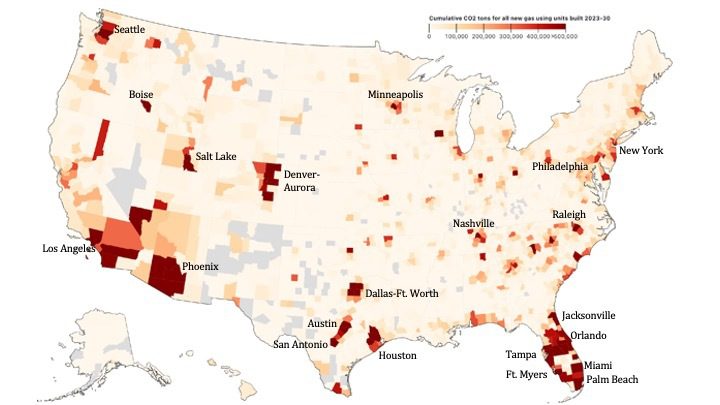
    We combined this complex dataset with the county level dataset on building permits surveys to estimate gas usage by volume for projected new builds out to 2030 by unit type, state, and climate zone. Next, we applied a US EPA GHG conversion factor (1 CcF gas = approximately 5.5 kg CO2) to estimate county-level emissions and to estimate the emissions from new builds using gas from 2023-2030. 

    Getting great results

    We discovered through this analysis that nationwide, building electrification policies targeting new buildings could eliminate nearly 140 million metric tons of CO2 by 2030. That’s like keeping over 320 million barrels of oil in the ground!

    Our analysis also highlights the significant impact of local policies. We identified that a relatively small number of policies in specific regions would have an outsized positive impact on emission reductions. Just twelve metropolitan areas account for over 30% of estimated cumulative CO2 emissions. As well, just 14 states contain over 70% of projected emissions from new housing stock between 2023 to 2030. We calculated this by identifying metropolitan areas using population figures for cities and counties as an approximation for emissions for projected new builds.  We used this data to rank top areas where building electrification policies would have the largest impact. 

    Creating effective strategies

    Finally, this county and metropolitan-level data was matched with states that don’t have pre-emption policies in place. This step allowed us to identify top places for the largest positive climate impact. We concluded that more than half (52%) of gas emissions from residential buildings constructed between 2023 and 2030 could be eliminated by passing policies in just 63 metropolitan areas and their surrounding counties. 

    By pulling from a wide range of sources and presenting the findings in a clear and actionable manner, we highlight the significant environmental and health benefits of building electrification. We provide a roadmap for achieving these goals by targeting top regions. Findings like these really highlight how targeted actions can have huge positive impacts for the climate. This research underscores the effectiveness of using accurate and comprehensive data to inform policy decisions. 

    – Dr. Devyani Singh, Investigative Researcher, Stand.earth Research Group

    Report Story

    Why are you reporting this Story?

    Your report is anonymous, except if you're reporting an intellectual property infringement. If someone is in immediate danger, call the local emergency services - don't wait.

    Report Story

    Any Additional Notes

    Your report is anonymous, except if you're reporting an intellectual property infringement. If someone is in immediate danger, call the local emergency services - don't wait.

    Report Story

    Thanks for letting us know

    We use these reports to:

    • Understand problems that people are having with different types of content on CauseCircle
    • Show you less of this kind of content in the future
    Share this story
    twitter-logo
    Twitter
    facebook-logo
    Facebook
    linkedin-logo
    LinkedIn
    whatsapp-logo
    WhatsApp
    reddit-logo
    Reddit
    telegram-logo
    Telegram
    pinterest-logo
    Pinterest
    email-logo
    Email
    Page link

    Please Sign In to continue

    Edit Story
    cause circle brand logo

    CauseCircle is a modern content collection hub for nonprofits. Collect all forms of powerful content - photos, videos, testimonials, reviews and field stories from your staff, volunteers, and supporters —  in one secure hub your nonprofit fully owns and controls.

    Turn everyday moments into proof of impact you can use across campaigns, grants, and fundraising to build transparency, trust, and donor confidence.

    Explore
    • About CauseCircle
    • FAQs
    • Nonprofit Directory
    • CauseCircle CMS
    • About the Product
    • Get Started
    • Partners
    • Help Center
    Contact
    • Email: hello@causecircle.org
    • Contact Us

    Copyright© 2025, All rights reserved.

    Terms of Service Privacy Policy